What Makes a Cap Rate Good
Cap Rate = Net Operating Income ÷ Price
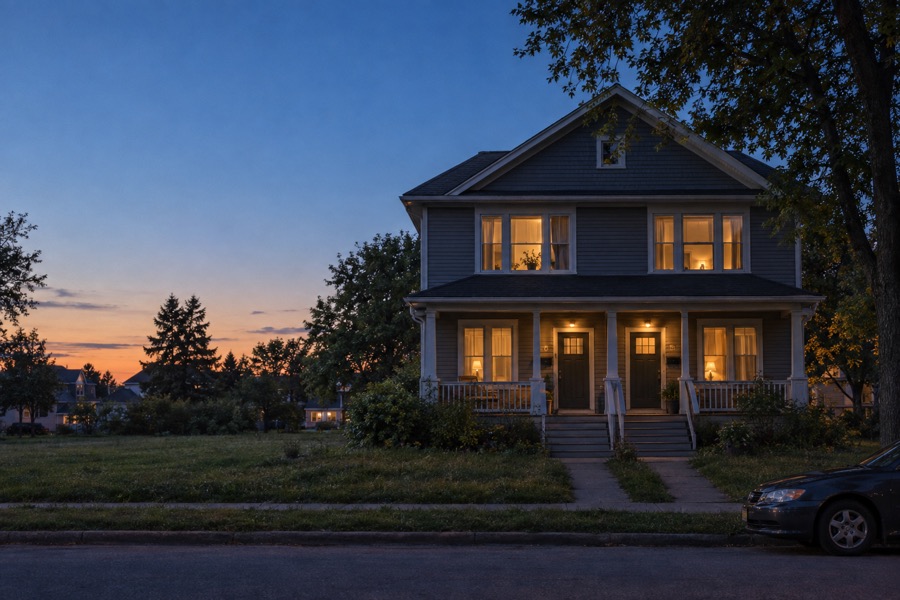
On the $425,000 duplex I use across this site, $26,220 of NOI ÷ $425,000 = 6.2%. Here is how that 6.2% runs through the three tests.
- Against the loan rate. Financed at 7%, the property earns less than the debt costs. That is negative leverage, worked below.
- Against the benchmark. The multifamily ranges in the CBRE survey cited below run from 4.5% to 6.0% across classes. 6.2% sits above the top of that range, which means the duplex is priced cheaper per dollar of income than a surveyed apartment building.
- Against the building. A cap rate above the benchmark is either a better deal or a worse property. The survey can't say which. Only the rent roll, the expense history, and an inspection can.
The order matters. A property can pass the benchmark test and fail the loan test, which is exactly where this duplex lands.
Cap Rate vs Interest Rate
Cap rate is the yield an all-cash buyer earns. Borrowing adds return only when the property earns more than the loan costs. When it earns less, every borrowed dollar pulls the return on the buyer's own cash down. That is positive versus negative leverage, and it is the first number I check.
The duplex, financed at 80% of price:
Loan: $340,000 at 7%, 30 years
Monthly payment: $2,262.03
Annual debt service: $27,144
Cash flow: $26,220 NOI − $27,144 = −$924
Cash-on-cash: −$924 ÷ ($85,000 down + $12,000 closing) = −1.0%
All cash, the duplex returns 6.2%. With an 80% loan at 7%, the return on the $97,000 of cash it takes to close, $85,000 down plus about $12,000 of closing costs, is negative 1.0%. Same building, same NOI. The loan turned a positive yield into a negative one because the 6.2% cap sits below the 7% rate.
The rate understates the gap. The comparison that decides cash flow is the cap rate against the loan constant, which is annual debt service divided by the loan amount, because the payment includes principal as well as interest:
Loan constant = $27,144 ÷ $340,000 = 7.98%
For the duplex to cover this loan from NOI alone, the cap rate would have to reach 7.98%. At $26,220 of NOI, that is a price of about $328,400. For the cap rate just to match the 7% interest rate, the price would have to be about $374,600. Neither is the asking price.
Principal paydown recovers some of this. In the first year the loan amortizes $3,454, which is equity the owner keeps. It shows up at sale or refinance, not in the bank account each month, and it doesn't change the fact that the property needs $924 a year from outside to carry its debt.
This is why, in a 7% rate environment, a cap rate below the borrowing cost means the buyer is paying for something other than current income. Usually that something is expected rent growth or appreciation. That can be a sound bet, but it is a bet, and the cap rate alone doesn't show it.
Cap rates also don't move one for one with the 10-Year Treasury. According to Marcus & Millichap research, movements in the 10-Year Treasury yield are only about 40% correlated with apartment cap rate movements, while transaction velocity has run about 78% correlated with cap rates since 2001. Rising rates don't automatically reprice the market. Buyers and sellers stop trading until one side gives, and the cap rate you see in a listing can lag the loan rate you get quoted.
Cap Rate Benchmarks by Property Type
The ranges below are from the semi-annual CBRE U.S. Cap Rate Survey, as cited on this page in July 2026. Survey ranges describe investment-size properties traded by professional buyers. A duplex or small fourplex trades on residential comps and local rent, so these ranges tell me where the broad market prices risk, not what a specific small property should sell for. The survey updates twice a year, and a range quoted from an old edition is the easiest way to misjudge a deal.
Multifamily
| Property Class | Typical Cap Rate |
|---|---|
| Class A (primary markets) | 4.5-5.25% |
| Class B | 4.9-5.5% |
| Class C | 5.4-6.0% |
Source: range as stated in the CBRE U.S. Cap Rate Survey. Check the current edition before relying on it.
Class C carries the highest cap rate because it carries the most operating risk: older systems, higher turnover, and more collections work. The extra yield pays for that work. It doesn't mean the income is cheaper in any risk-adjusted sense.
Industrial
| Property Class | Typical Cap Rate |
|---|---|
| Class A | 5.0-6.25% |
| Class B | 6.3-7.0% |
| Class C | 6.7-7.5% |
Source: range as stated in the CBRE U.S. Cap Rate Survey. Check the current edition before relying on it.
The spread between classes is wider than in multifamily because an older warehouse can become functionally obsolete (low clear heights, poor truck access) in a way an older apartment rarely does. The higher cap on Class B and C prices that obsolescence risk.
Retail
| Property Type | Typical Cap Rate |
|---|---|
| Single-tenant NNN (credit tenant) | 5.0-6.8% |
| Grocery-anchored centers | 5.75-6.5% |
| Strip centers | 6.4-8.0% |
| Neighborhood retail | 7.0-8.5% |
Source: range as stated in the CBRE U.S. Cap Rate Survey. Check the current edition before relying on it.
In retail the cap rate mostly prices the tenant rather than the building. A single-tenant net lease to a credit tenant trades like a bond, and its cap rate tracks the tenant's credit and remaining lease term. When that lease nears expiration, the same building can reprice sharply, because the income the cap rate was built on is no longer contracted.
Office
| Property Class | Typical Cap Rate |
|---|---|
| Class A (CBD) | 6.0-7.5% |
| Class A (Suburban) | 6.5-8.0% |
| Class B/C | 8.5-11.0%+ |
Source: range as stated in the CBRE U.S. Cap Rate Survey. Check the current edition before relying on it.
Office shows the widest ranges on this page, and the open-ended top of the Class B/C row is the tell. A wide range means buyers disagree about what the income will be in five years. An 11% cap on an office building is the market pricing vacancy it expects but hasn't happened yet.
Cap Rates by Market Tier
Within any property type, cap rates run lowest in gateway cities, higher in major and secondary metros, higher again in tertiary markets, and highest in rural areas. I'm not putting numbers on those steps here, because I don't have a single citable source that publishes them as fixed adjustments. The CBRE survey reports ranges by market, and that's where the spread for a specific metro lives.
The mechanism is consistent across tiers. Buyers accept a lower cap rate where they expect rent growth, deep buyer demand at resale, and low odds of a long vacancy. A market with a shrinking job base or one dominant employer has to offer more income per dollar to attract the same buyer. The higher cap rate is compensation, and the question is whether it's enough.
Risk and Condition: Two Traps
The benchmark test tells me whether a cap rate is high or low for its category. It can't tell me why. Two situations regularly fool that test.
A high cap rate in a weak market. A property priced at 8% in a declining town looks like a bargain against a 6% benchmark. On the duplex's $26,220 of NOI, an 8% cap is a price of $327,750. But the cap rate is calculated on today's NOI. If population and jobs are leaving, rents flatten, vacancy creeps up, and next year's NOI is lower than this year's. The yield on a falling income stream is lower than the one printed on the listing. High cap rates also collect deferred maintenance, since a roof or a furnace that capital spending hasn't replaced yet never touches NOI.
A low cap rate on a value-add property. The reverse trap. A building with below-market rents or high vacancy shows a low in-place cap rate, and it can look overpriced against the benchmark. If the duplex traded at $524,400, the in-place cap on $26,220 would be 5.0%. A buyer paying that is buying the NOI after renovation and re-leasing, not the NOI today. The low cap is priced for work the seller hasn't done and the buyer will pay for. Whether that is a good price depends entirely on how much the rents move and what the renovation costs, and neither shows up in the cap rate.
The same arithmetic runs through both traps: a cap rate is one year of income divided by price, and the market prices in years two through ten. When a cap rate sits far from its benchmark, in either direction, the distance is usually a forecast.
FAQ
What is a good cap rate for a rental property?
One that exceeds the loan constant on the financing you'd actually use, sits in a sensible place against the published range for that property type and market, and is built on NOI that holds up after checking the expenses. On the duplex, 6.2% passes the benchmark test and fails the financing test at 7%.
Is a higher cap rate always better?
No. A higher cap rate means more income per dollar of price, and usually more risk: an older building, a weaker market, shorter leases, or deferred capital work. The extra yield is what the market charges to take that risk on.
Should the cap rate be higher than the mortgage rate?
If the goal is positive cash flow from the loan, the cap rate has to beat the loan constant, not just the interest rate. On a 30-year loan at 7%, the constant is 7.98%. A 6.2% cap against that loan produces negative leverage and −$924 a year in cash flow on the duplex.
Where do I find current cap rates for my market?
The CBRE U.S. Cap Rate Survey (semi-annual) and Marcus & Millichap research publish ranges by property type and market. For small residential rentals, local sold comps and actual rents are the closer benchmark, since the surveys track larger properties.
Related Reading
- Cap Rate Explained: the formula, how NOI is built, and what the cap rate leaves out
- Cash-on-Cash Return Guide: the return after financing, which is where negative leverage shows up
- Cap Rate vs Cash-on-Cash: why the two metrics disagree on the same building
Keep reading
- 1031 Exchange Rules: Timelines, Like-Kind Property and What Gets DeferredHow a 1031 exchange defers capital gains on a property sale: the like-kind and equal-value rules, the 45 and 180 day deadlines, and where exchanges fail.
- Break-Even Occupancy: How Empty a Rental Can Get Before It Loses MoneyThe break-even occupancy and break-even rent formulas for a rental property, worked with real numbers, and what the result says about risk and financing.
- The BRRRR Method: Buy, Rehab, Rent, Refinance, Repeat, With the MathHow the BRRRR method works step by step, how much cash the refinance actually returns, and where the numbers break when the appraisal comes in low.